
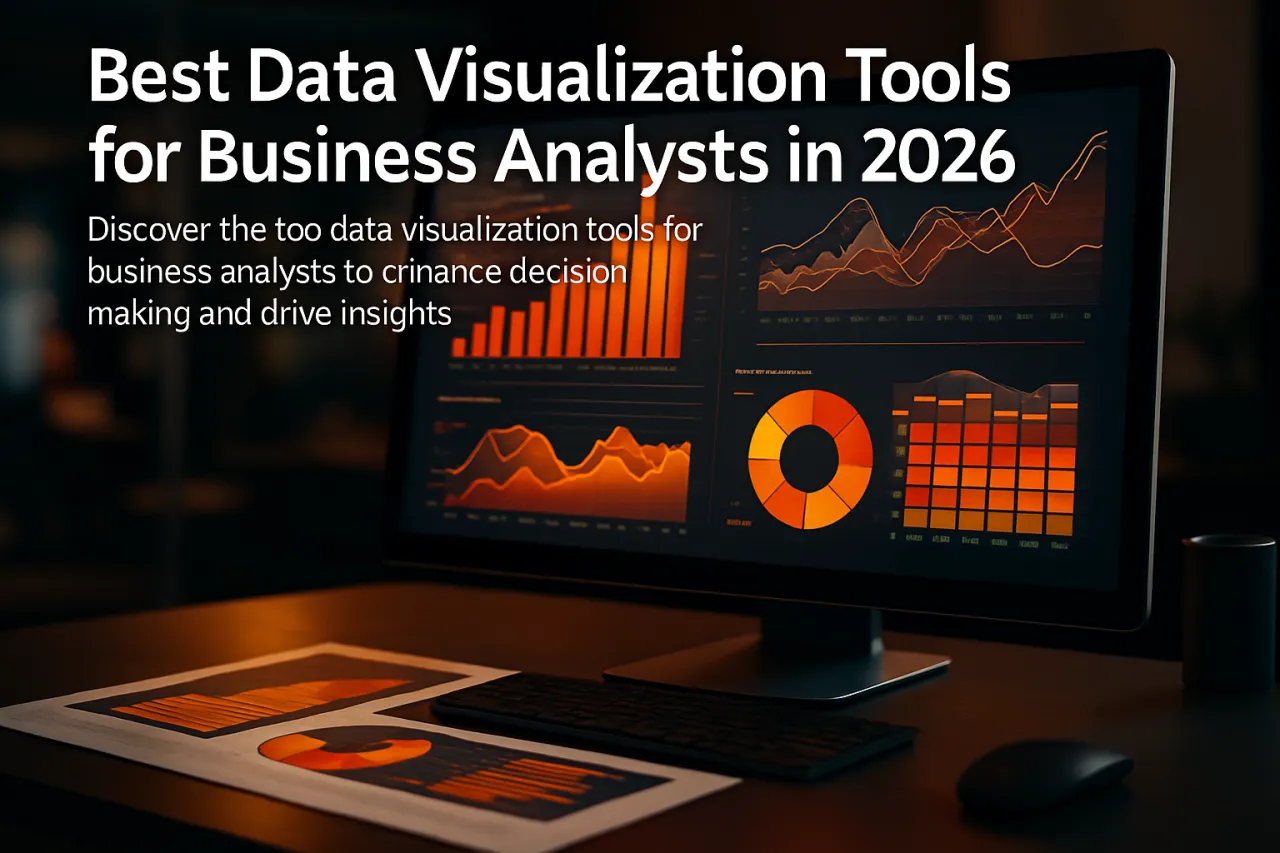
Best Data Visualization Tools for Business Analysts in 2026
Introduction
In today's data-driven environment, the ability to distill complex information into understandable visuals is crucial for business analysts. Data visualization tools not only help in presenting data but also play a pivotal role in decision-making processes. With the right tools, analysts can transform raw data into compelling graphics that reveal trends, patterns, and insights that might otherwise go unnoticed.
This article will explore some of the best data visualization tools available in 2026, focusing on their key features, pricing structures, and ideal use cases. By equipping yourself with the right tools, you can significantly enhance your business analytics capabilities and ultimately contribute to better strategic decisions.
What Is Data Visualization?
Data visualization is the graphical representation of information and data. By using visual elements like charts, graphs, and maps, data visualization tools enable users to see analytics presented visually, allowing them to understand difficult concepts or identify new patterns. Business analysts utilize these tools to consolidate data from various sources and present it in a way that stakeholders can easily comprehend.
Why It Matters
In the realm of business analytics, the ability to convey insights effectively can be the difference between success and failure. Visualizations not only simplify complex datasets but also enhance storytelling around the data, making it easier for teams to interpret findings and make informed decisions. Moreover, as businesses continue to generate massive amounts of data, utilizing effective visualization tools becomes increasingly essential to harness this information for strategic advantage.
Best Data Visualization Tools for Business Analysts
Tableau
Overview
Tableau is a leading data visualization platform that allows users to create interactive and shareable dashboards. It connects to nearly any database and can handle large volumes of data seamlessly.
Strengths
- Robust integration capabilities with various data sources.
- Drag-and-drop interface makes it user-friendly.
- Offers real-time data analytics.
Limitations
- Can be expensive for smaller teams.
- Steeper learning curve for advanced features.
Best for
Large organizations needing comprehensive analytics.
Pricing overview
Tableau offers a free public version, while the professional version starts at approximately $70 per user per month.
Power BI
Overview
Microsoft Power BI is a powerful analytics tool that provides interactive visualizations and business intelligence capabilities. It integrates well with other Microsoft products, enhancing its usability for businesses already using the Microsoft ecosystem.
Strengths
- Strong integration with Microsoft Office tools.
- Affordable pricing structure.
- User-friendly interface with a wide variety of visualization options.
Limitations
- Limited data capacity compared to Tableau.
- Can have performance issues with very large datasets.
Best for
Organizations using Microsoft products seeking cost-effective solutions.
Pricing overview
Power BI is available at a free tier, while the Pro version is about $10 per user per month.
Qlik Sense
Overview
Qlik Sense offers a self-service data analytics platform that helps users create personalized reports and dashboards. Its associative model allows for intuitive data exploration.
Strengths
- Associative data model enhances data exploration.
- Strong analytical capabilities.
- Extensive community and support resources.
Limitations
- The interface may feel less intuitive to new users.
- Higher price point compared to some alternatives.
Best for
Businesses requiring advanced analytics and insights.
Pricing overview
Pricing for Qlik Sense starts around $30 per user per month for the Business edition.
Google Data Studio
Overview
Google Data Studio is a free tool that allows users to convert data into informative, easy-to-read, easy-to-share dashboards and reports.
Strengths
- Completely free to use.
- Easy integration with other Google services.
- Real-time collaboration features.
Limitations
- Limited customization options for advanced users.
- May not handle large datasets efficiently.
Best for
Small to medium businesses looking for cost-effective solutions.
Pricing overview
Google Data Studio is free for all users.
How to Choose the Right Solution
When evaluating data visualization tools, consider the following criteria:
- Integration: Ensure the tool integrates well with your existing data sources.
- User Experience: Look for an intuitive interface that your team can adopt quickly.
- Functionality: Identify the specific features you need, such as real-time data updates or mobile accessibility.
- Scalability: Consider whether the tool can grow with your organization’s needs.
- Cost: Assess your budget against licensing fees and any additional costs for training or support.
Common Mistakes
- Neglecting User Training: Failing to invest time in training users can lead to underutilization of the tools.
- Choosing Based on Price Alone: While budget is important, choosing a tool solely based on price can hinder your analytics capabilities.
- Overcomplicating Visualizations: Using too many visual elements can confuse rather than clarify. Keep it simple.
Frequently Asked Questions
1. What are data visualization tools?
Data visualization tools are software applications that help users create visual representations of data to facilitate understanding and insights.
2. Why is data visualization important for business analysts?
Data visualization helps business analysts present data effectively, making it easier for stakeholders to grasp insights and make data-driven decisions.
3. Can I use free tools for data visualization?
Yes, there are excellent free options like Google Data Studio that can meet the needs of many businesses.
4. How do I determine which data visualization tool is best for my company?
Consider factors like integration capabilities, user experience, required functionalities, scalability, and pricing when making your decision.
5. What common mistakes should I avoid when using data visualization tools?
Avoid neglecting user training, choosing based on price alone, and overcomplicating visualizations, as these can hinder effectiveness.
Conclusion
Choosing the right data visualization tool is essential for effective business analytics. By understanding the features and limitations of each option and aligning them with your organizational needs, you can enhance your ability to drive insights and make informed decisions. Whether you opt for a robust solution like Tableau or a free tool like Google Data Studio, the right choice will empower your business to leverage data more effectively.
About the Author
Digital Marketing Expert
With a background in Design Tools, Tania Gondal brings hands-on expertise to evaluating the latest Design Tools tools. She has reviewed hundreds of SaaS products for startups and enterprises alike.