Why Look for Alternatives to Dataspot?
While Dataspot is a promising data analysis tool, it has several limitations that make users seek alternatives. One of the most notable concerns is its pricing model, which is currently labeled as freemium but lacks transparency regarding any premium features and costs. Users often find themselves unsure about what value they will receive from paid features, leading to frustration and indecision. Moreover, Dataspot's user interface has been criticized for being less intuitive than competitors, making it challenging for new users to harness its full potential quickly. This issue can significantly affect productivity, especially for teams that require fast analytics turnaround.
Additionally, Dataspot may not cater effectively to specific use cases, such as advanced data visualization or real-time analytics. Many users report that while Dataspot can handle basic data tasks, it falls short when complex analytical scenarios arise. Users seeking to create publication-ready reports or those who require seamless integrations with other platforms may feel limited by Dataspot's capabilities. These factors contribute to a growing number of users exploring alternatives that offer more robust features, better user experiences, and clearer pricing structures.
Best Alternatives to Dataspot in 2026
PlotStudio AI - Best for AI-Driven Analytics Reporting
PlotStudio AI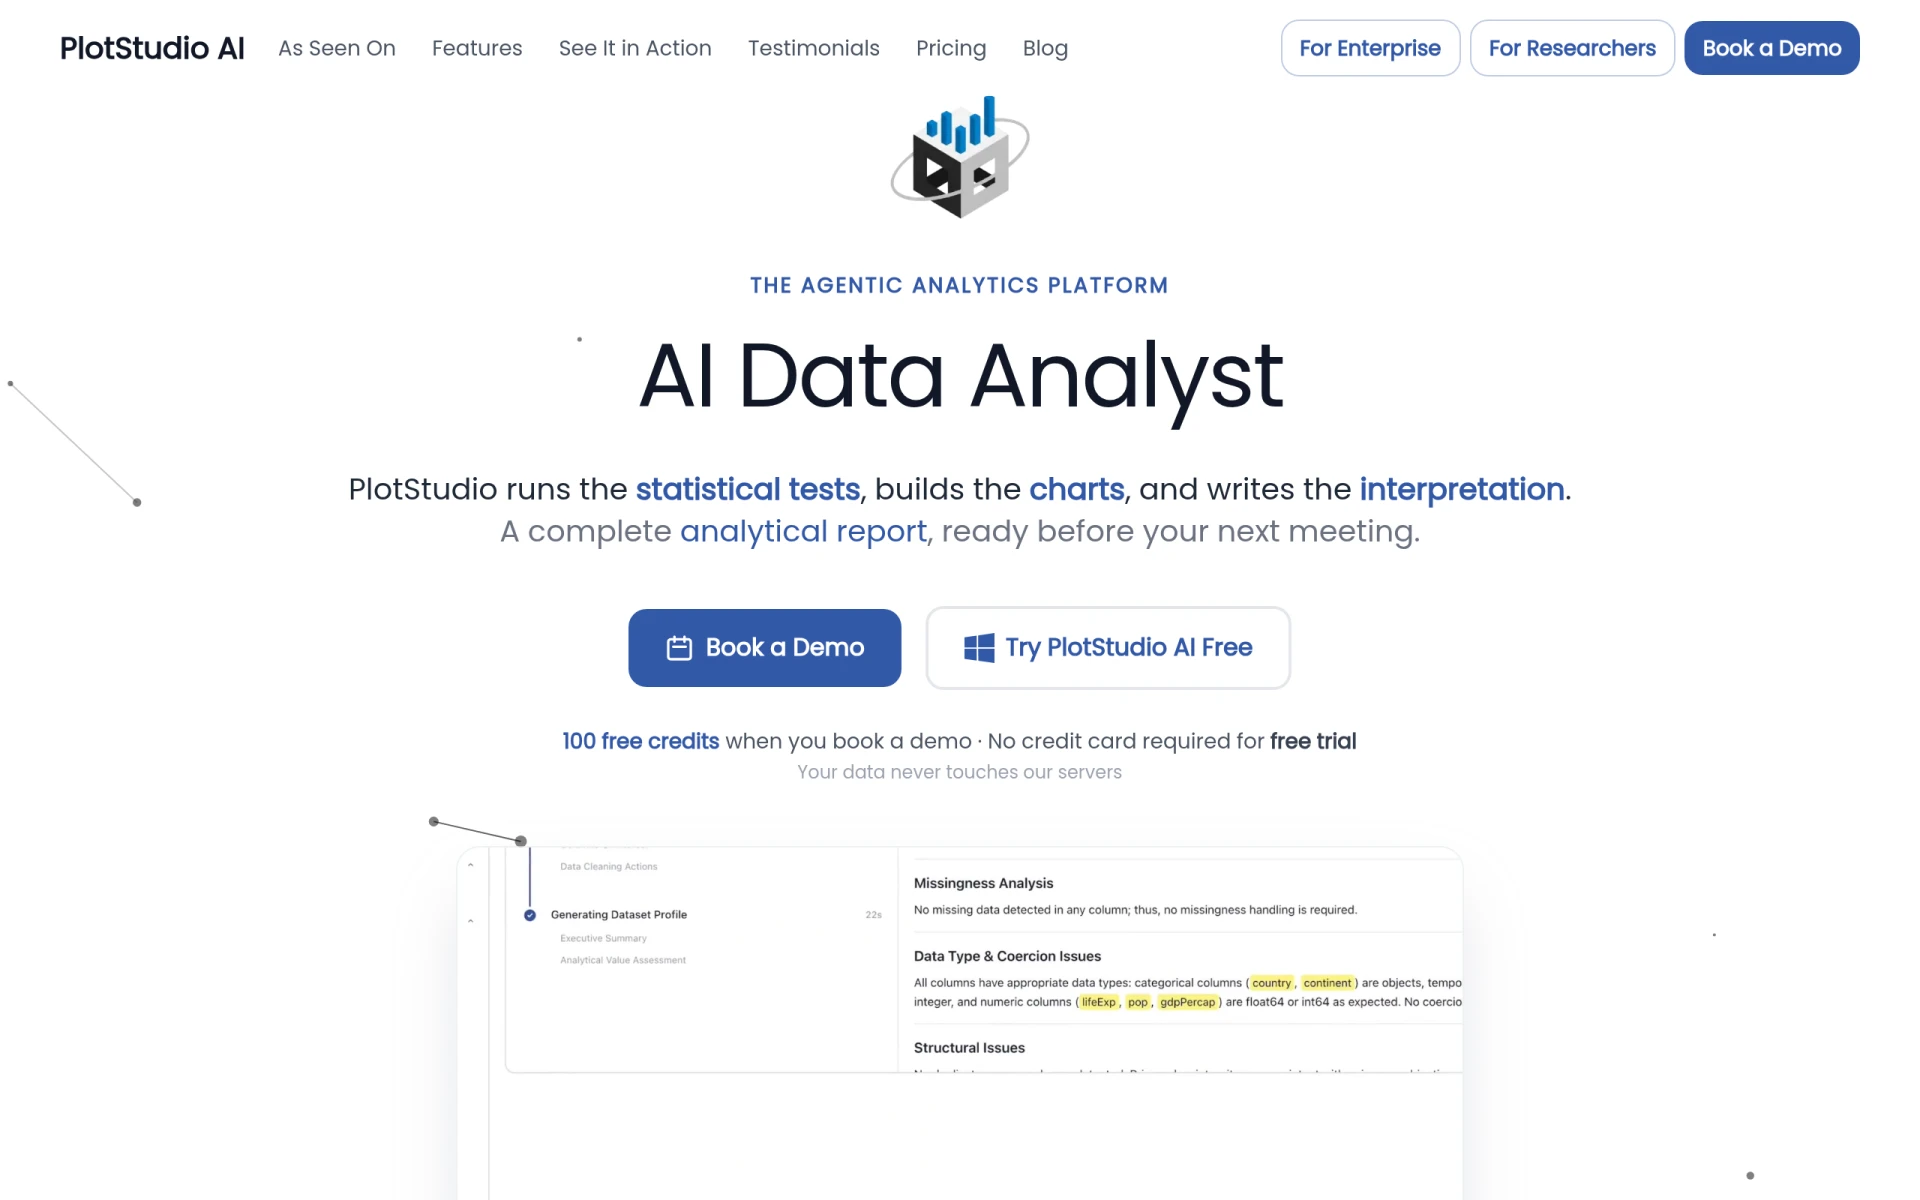 is an innovative analytics platform that stands out for its ability to transform raw data into publication-ready analytics pages through the use of AI agents. Unlike Dataspot, which may require manual setup for visualizations, PlotStudio AI automates much of the reporting process, making it ideal for users who need to generate complex reports quickly. This tool is particularly suited for businesses that prioritize aesthetics in their data presentations, as it offers customizable templates and layouts that enhance the readability and impact of data insights.
In addition to its automation capabilities, PlotStudio AI also allows users to integrate various data sources seamlessly. This feature provides an edge over Dataspot, which can sometimes struggle with data integration from multiple platforms. Users who deal with large volumes of data from different channels will find PlotStudio AI's versatility to be a significant advantage. The intuitive UI makes it easy for both technical and non-technical users to navigate, ensuring everyone on the team can leverage data effectively.
- Key Strength: AI-driven automation for creating publication-ready reports with minimal effort.
- Key Strength: Seamless integration with multiple data sources, enhancing versatility.
- Key Strength: User-friendly interface that accommodates various skill levels.
- Limitation: Some advanced customization features may require a learning curve.
Pricing: Freemium with various subscription plans based on usage credits. Best for: Teams needing automated, high-quality reporting and diverse data integrations.
ChartPixel - Best for Interactive Data Visualization
ChartPixel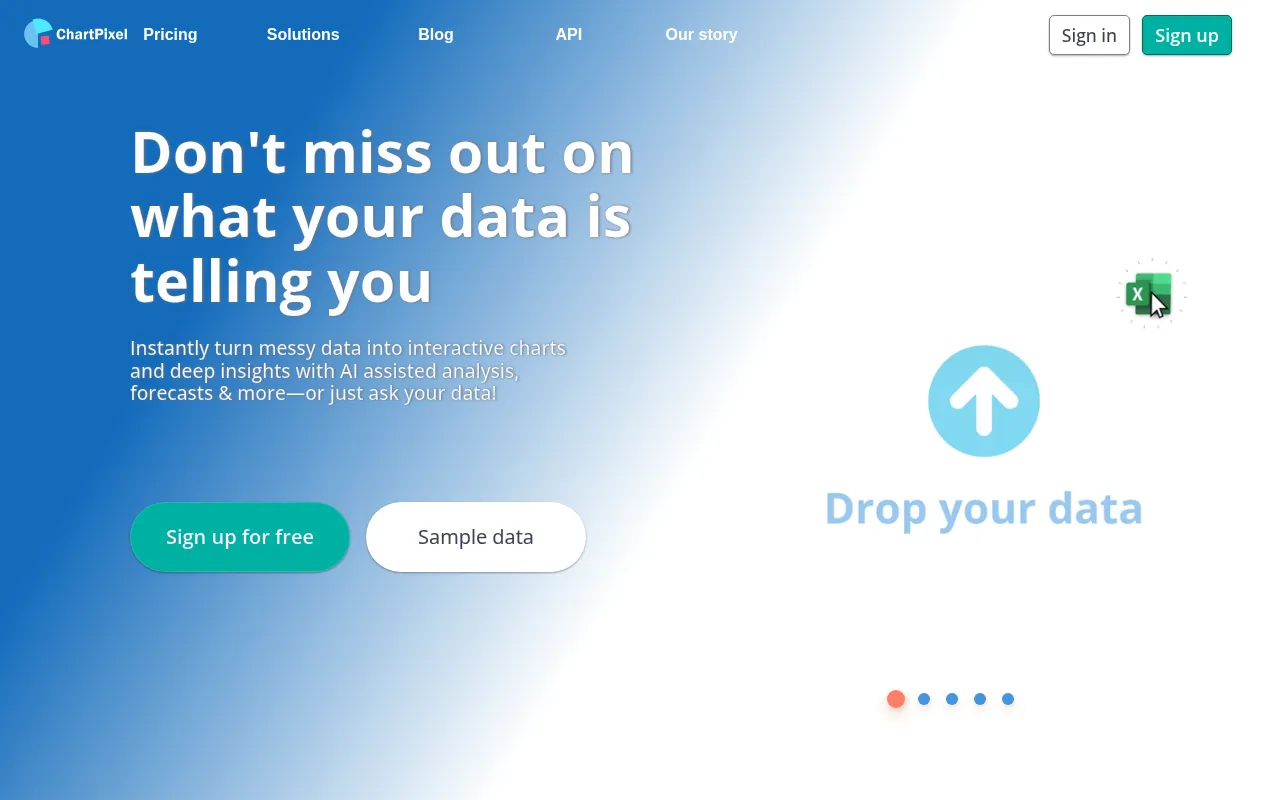 is an analytics tool that excels in providing instant AI-driven data analysis and interactive charting capabilities. For users looking for a more dynamic approach to data visualization than what Dataspot offers, ChartPixel is an excellent choice. Its AI algorithms quickly transform raw data into interactive charts, allowing users to explore data visually and derive insights that are hard to capture with static reports. This makes it particularly beneficial for teams that thrive on visual data storytelling.
Moreover, ChartPixel's interactive dashboard offers real-time analytics features that are often lacking in Dataspot. Users can manipulate data on-the-fly, adjusting parameters to see immediate changes in their visualizations. This immediacy is crucial for teams that need to pivot quickly during decision-making processes. Additionally, the tool's collaborative features allow multiple users to work on the same project simultaneously, fostering teamwork and enhancing productivity.
- Key Strength: Instant AI-driven analysis that delivers interactive charts for enhanced data exploration.
- Key Strength: Real-time analytics features that provide immediate feedback and insights.
- Key Strength: Collaborative functionality that allows multiple users to work on projects simultaneously.
- Limitation: May not provide as extensive reporting options as some competitors.
Pricing: Freemium with various subscription options available. Best for: Teams focused on interactive visualizations and real-time data exploration.
Pandada AI - Best for Non-Technical Users
Pandada AI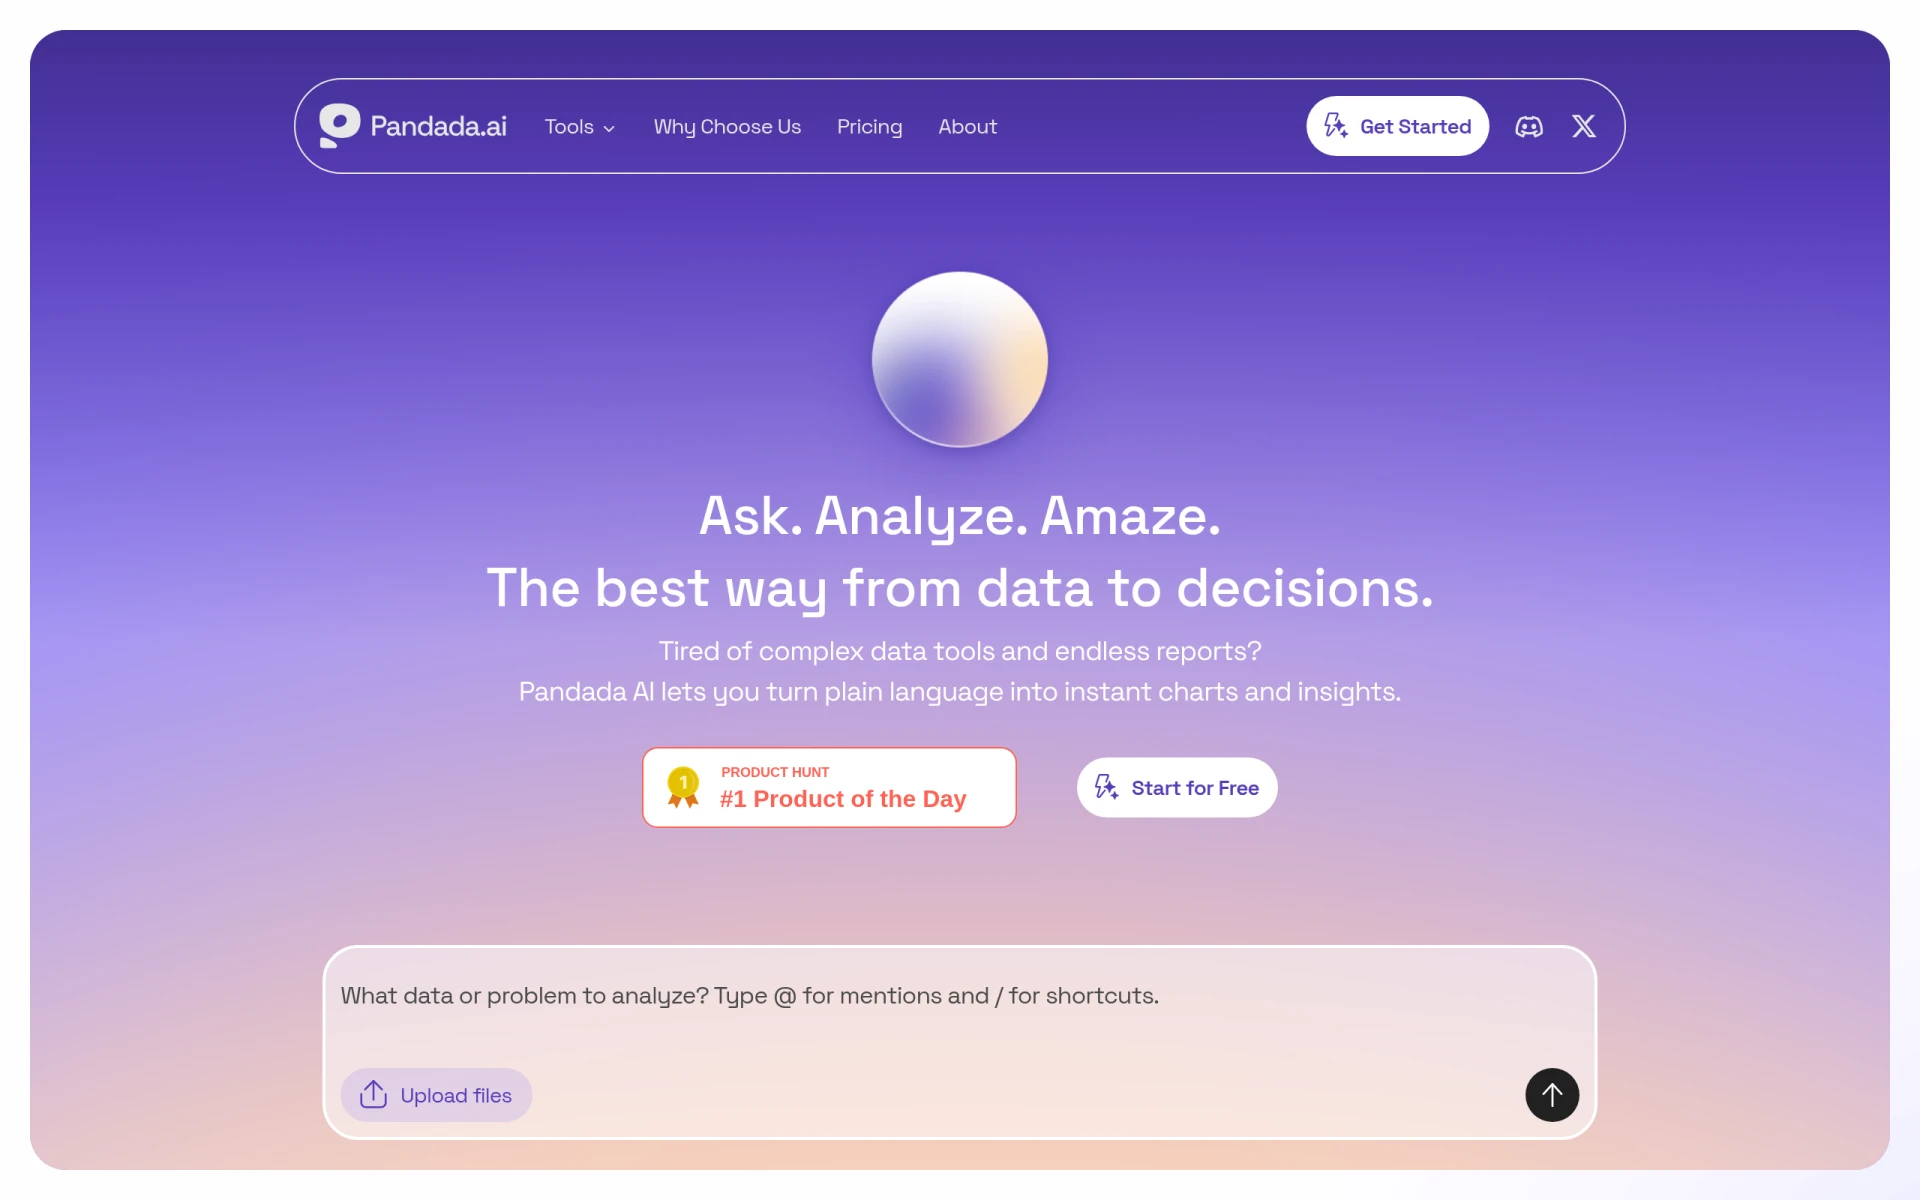 is designed to simplify data analysis for users with little to no coding experience. This tool is particularly advantageous for businesses that need to convert messy data files into clear insights without requiring extensive technical knowledge. Unlike Dataspot, which may present a steeper learning curve, Pandada AI offers a user-friendly interface that guides users through the analysis process step-by-step. This makes it a popular choice among business users who need actionable insights quickly and efficiently.
What sets Pandada AI apart is its ability to handle a wide variety of data formats and transform them into usable insights effortlessly. Users can upload different types of messy files, and Pandada AI will automatically clean and structure the data for analysis. This level of automation reduces the time spent on data preparation, allowing teams to focus on deriving insights rather than getting bogged down in technical details. It’s particularly useful for small to medium-sized businesses that may not have dedicated data teams.
- Key Strength: User-friendly interface designed for non-technical users, facilitating easy data analysis.
- Key Strength: Automatic data cleaning and structuring capabilities that save time.
- Key Strength: Supports a wide range of data formats for flexible usage.
- Limitation: Advanced features may be limited for users looking for deeper analytical capabilities.
Pricing: Freemium, with specific pricing details currently unavailable. Best for: Non-technical users needing straightforward data analysis solutions.
TextQL - Best for Natural Language Querying
TextQL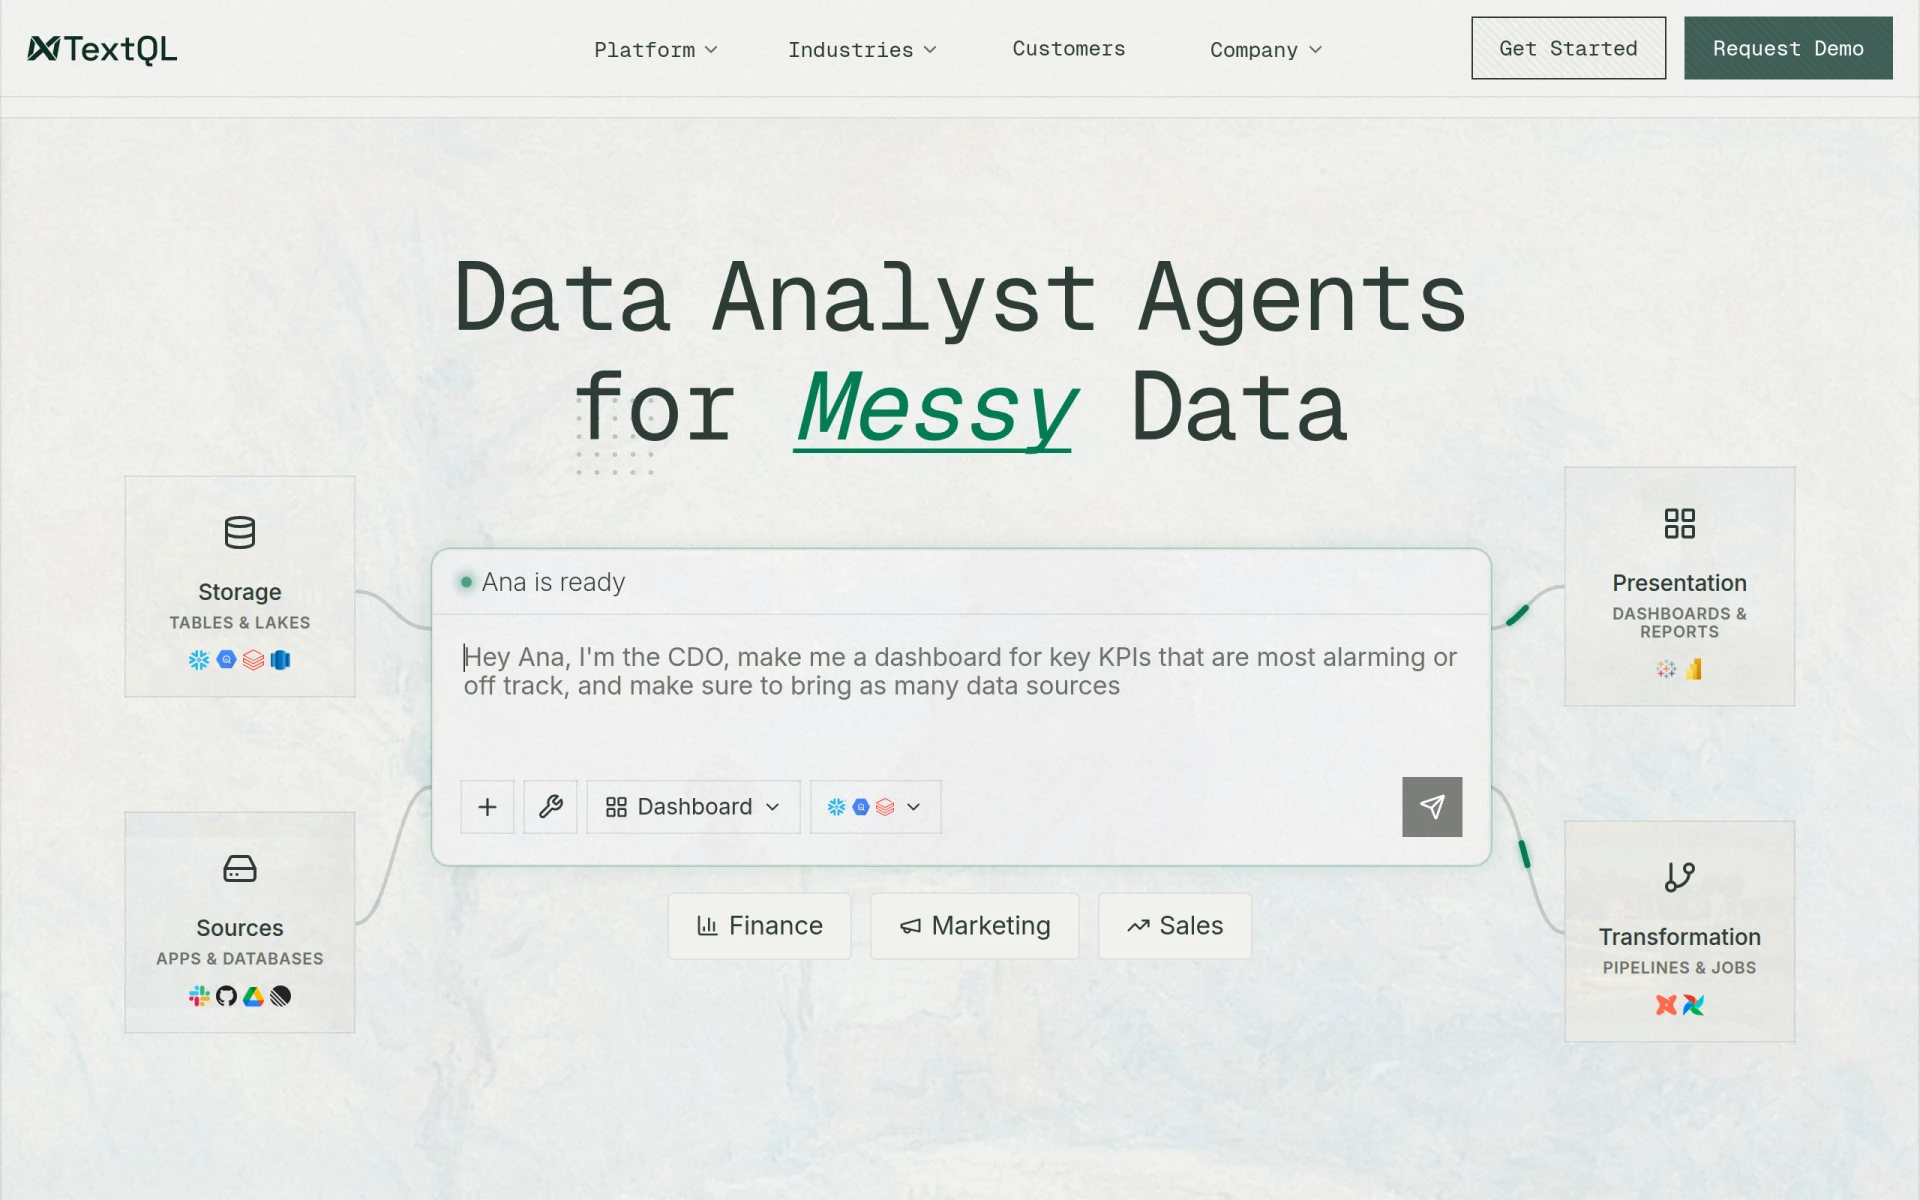 is an innovative analytics tool that allows users to query and analyze messy data using plain English. This feature sets it apart from Dataspot, which typically requires users to understand more technical query languages or frameworks. TextQL is particularly beneficial for users who may not be data experts but still need to extract meaningful insights from complex datasets. This natural language processing capability empowers all team members to engage with data without needing specialized training.
The charm of TextQL lies in its ability to interpret user queries in natural language and convert them into structured queries that can pull meaningful data from various sources. This makes it an excellent choice for organizations looking to democratize data access across departments. Users can easily ask questions and receive answers based on real-time data, enhancing overall decision-making processes. Additionally, its freemium model allows teams to experiment with the tool without significant commitment, making it an attractive option for startups and small businesses.
- Key Strength: Natural language querying enables users to interact with data in a more intuitive way.
- Key Strength: Quick insights derived from real-time data responses based on user questions.
- Key Strength: Freemium model allows for experimentation with minimal risk.
- Limitation: May not handle highly complex queries as effectively as other tools.
Pricing: Freemium with various pricing plans including a free tier for prototyping. Best for: Teams seeking intuitive data querying solutions without technical jargon.
Metaplane - Best for Data Quality Monitoring
Metaplane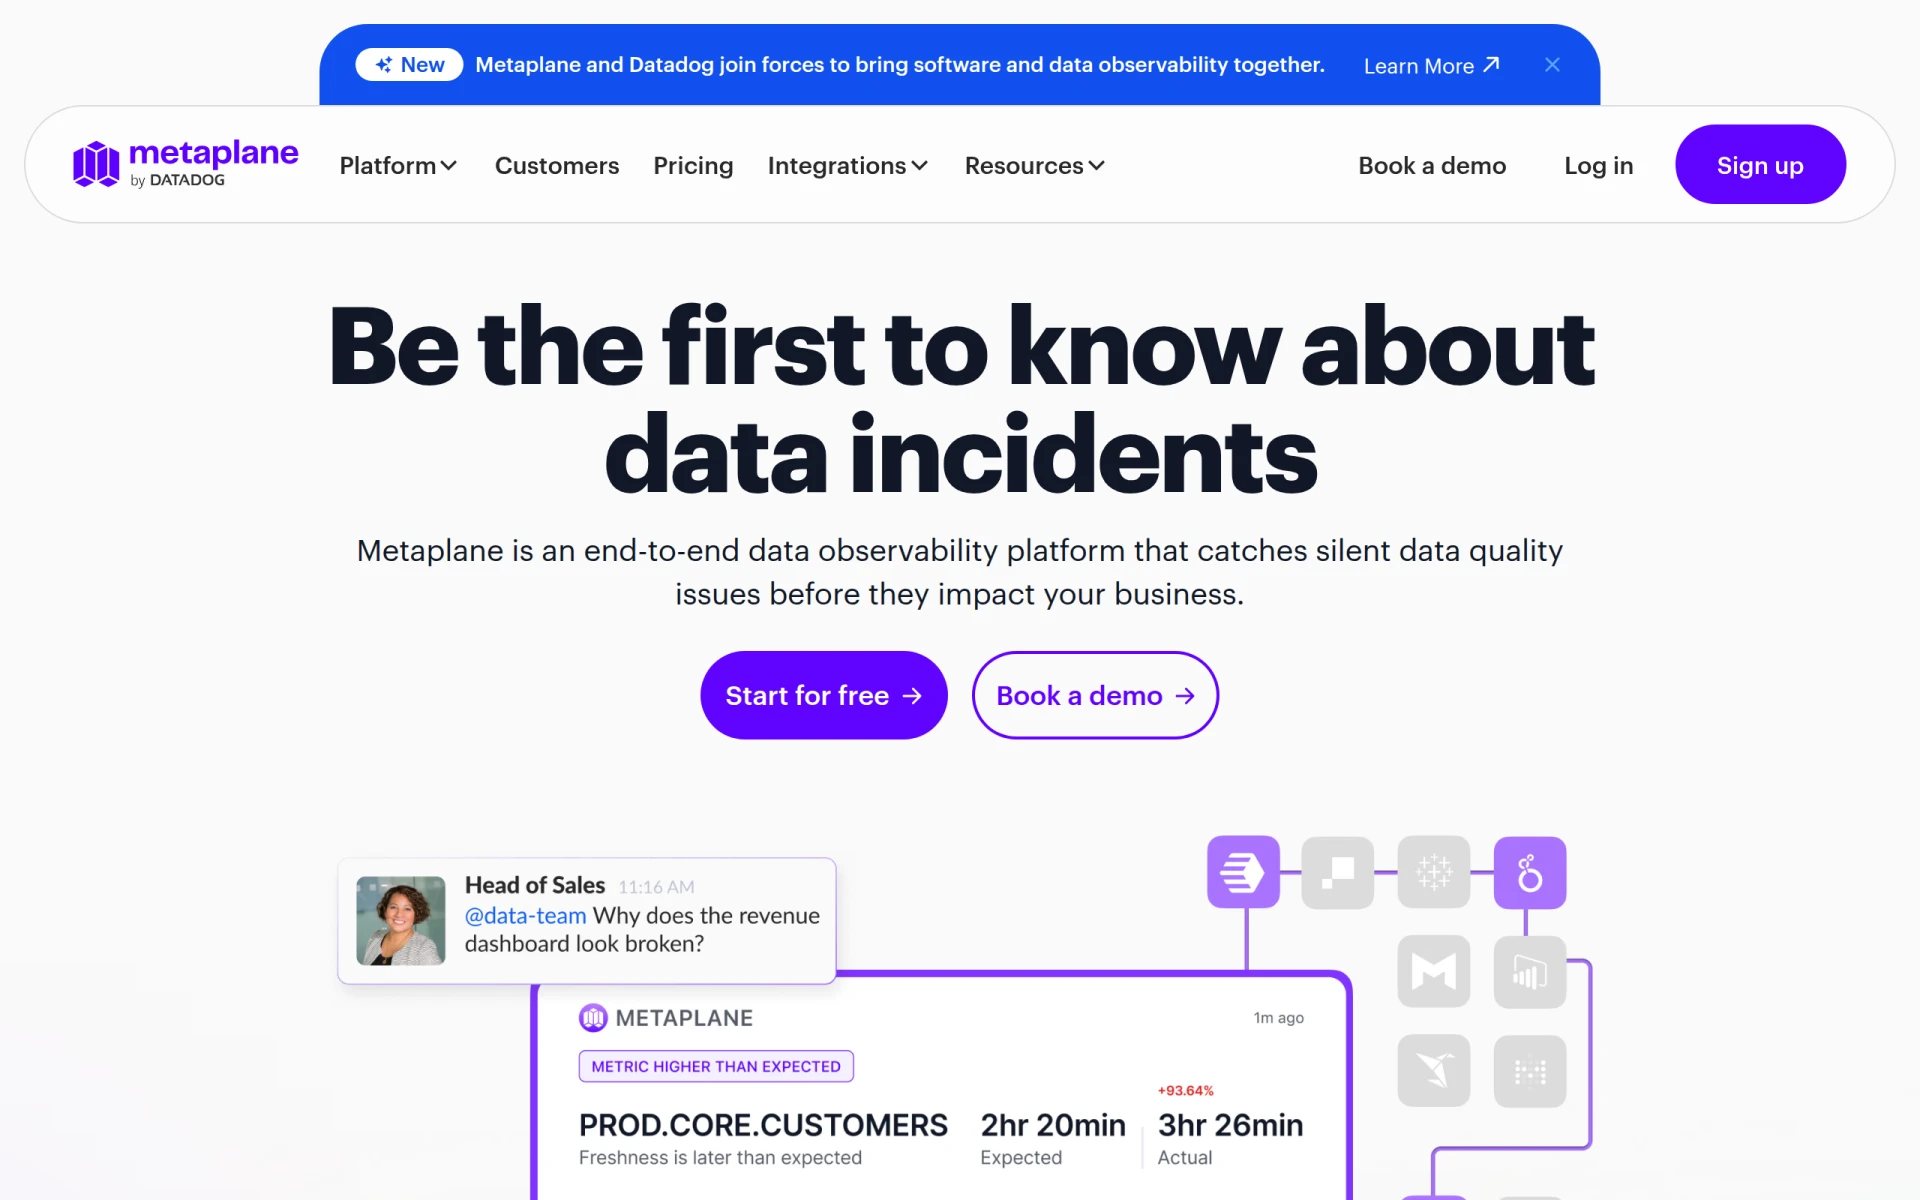 is a data observability platform focused on identifying and resolving data quality issues before they impact business operations. This tool is particularly relevant for organizations that rely heavily on accurate data for decision-making. Unlike Dataspot, which primarily focuses on data analysis and visualization, Metaplane emphasizes the importance of data integrity and quality control. Businesses that have experienced data-related issues will appreciate Metaplane's proactive approach to monitoring data health.
What makes Metaplane a standout choice is its ability to integrate seamlessly with various data pipelines and platforms. This allows users to gain insights into data quality metrics across their entire infrastructure. By doing so, teams can address potential issues before they escalate, ensuring that all analyses performed using the data are based on reliable information. This capability is crucial for businesses that cannot afford to make decisions based on flawed data, making Metaplane a vital tool for data-driven organizations.
- Key Strength: Focus on data quality monitoring to prevent issues before they impact analysis.
- Key Strength: Seamless integration with various data pipelines for comprehensive insights.
- Key Strength: Proactive alerts that notify teams of potential data integrity issues.
- Limitation: May not provide deep analytical capabilities for data visualization.
Pricing: Freemium with a paid model based on usage after a trial period. Best for: Businesses prioritizing data quality and integrity in their analytics processes.
Uptrends.ai - Best for Website Performance Analytics
Uptrends.ai is a specialized analytics tool that focuses on tracking and analyzing website performance effectively. This tool is particularly beneficial for digital marketing teams and web developers who need to understand user behavior and site performance metrics. In contrast to Dataspot, which offers a broader analytics approach, Uptrends.ai hones in on web-specific performance metrics, allowing users to tailor their strategies based on real-time insights from their websites.
One of the key strengths of Uptrends.ai is its ability to monitor website uptime, page speed, and user experience, providing comprehensive reports that help teams make informed decisions about website improvements. Users can access analytics related to traffic sources, user demographics, and engagement, enabling them to optimize their marketing efforts effectively. While Dataspot may provide general data analysis, Uptrends.ai focuses specifically on web analytics, making it a valuable asset for businesses with a strong online presence.
- Key Strength: Specialization in website performance analytics for targeted insights.
- Key Strength: Comprehensive tracking of metrics like uptime, page speed, and user experience.
- Key Strength: Tailored reports that inform website improvement strategies.
- Limitation: May not cater to broader business analytics needs outside website performance.
Pricing: Freemium, with pricing information currently unavailable. Best for: Digital marketing teams and web developers focused on website performance metrics.
Arcwise - Best for Early Metric Detection
Arcwise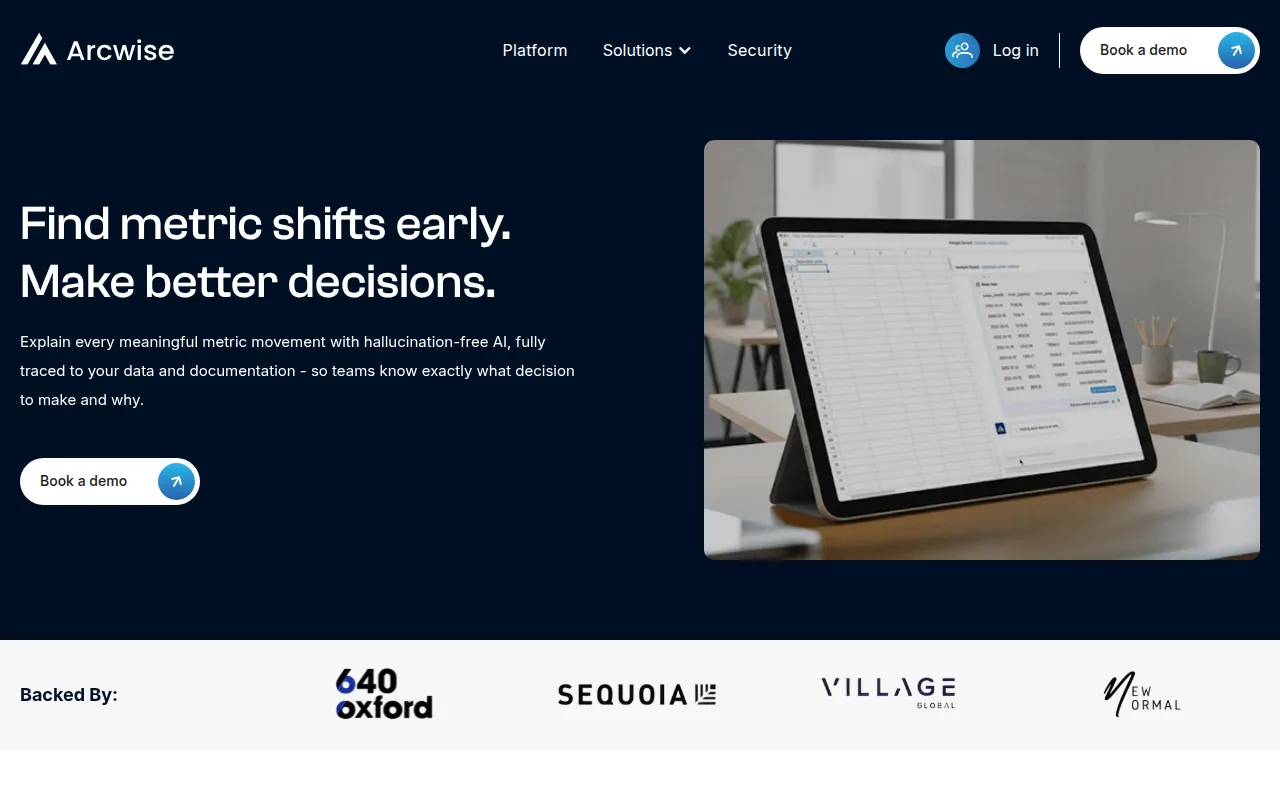 is a specialized analytics tool designed for early metric detection, allowing teams to act on meaningful data shifts promptly. This tool is particularly useful for organizations that need to monitor critical performance indicators in real-time. Unlike Dataspot, which may provide a retrospective view of data, Arcwise focuses on identifying trends as they develop, enabling proactive decision-making. This is especially crucial for businesses in fast-paced environments where timely insights can lead to competitive advantages.
The tool’s strength lies in its ability to provide alerts and notifications when significant data shifts occur. This feature empowers teams to investigate anomalies, understand underlying causes, and adjust strategies swiftly to mitigate risks. Arcwise is well-suited for organizations that require continuous monitoring of key metrics across various departments. Businesses that prioritize agility and responsiveness will find Arcwise to be an invaluable addition to their analytics toolkit.
- Key Strength: Real-time alerts for early detection of metric shifts.
- Key Strength: Proactive approach to data monitoring that supports timely decision-making.
- Key Strength: Focus on critical performance indicators for targeted insights.
- Limitation: Limited capabilities for in-depth analysis beyond early detection.
Pricing: Contact for pricing information. Best for: Organizations needing proactive monitoring of key performance indicators.
Airbook - Best for Go-To-Market Analytics
Airbook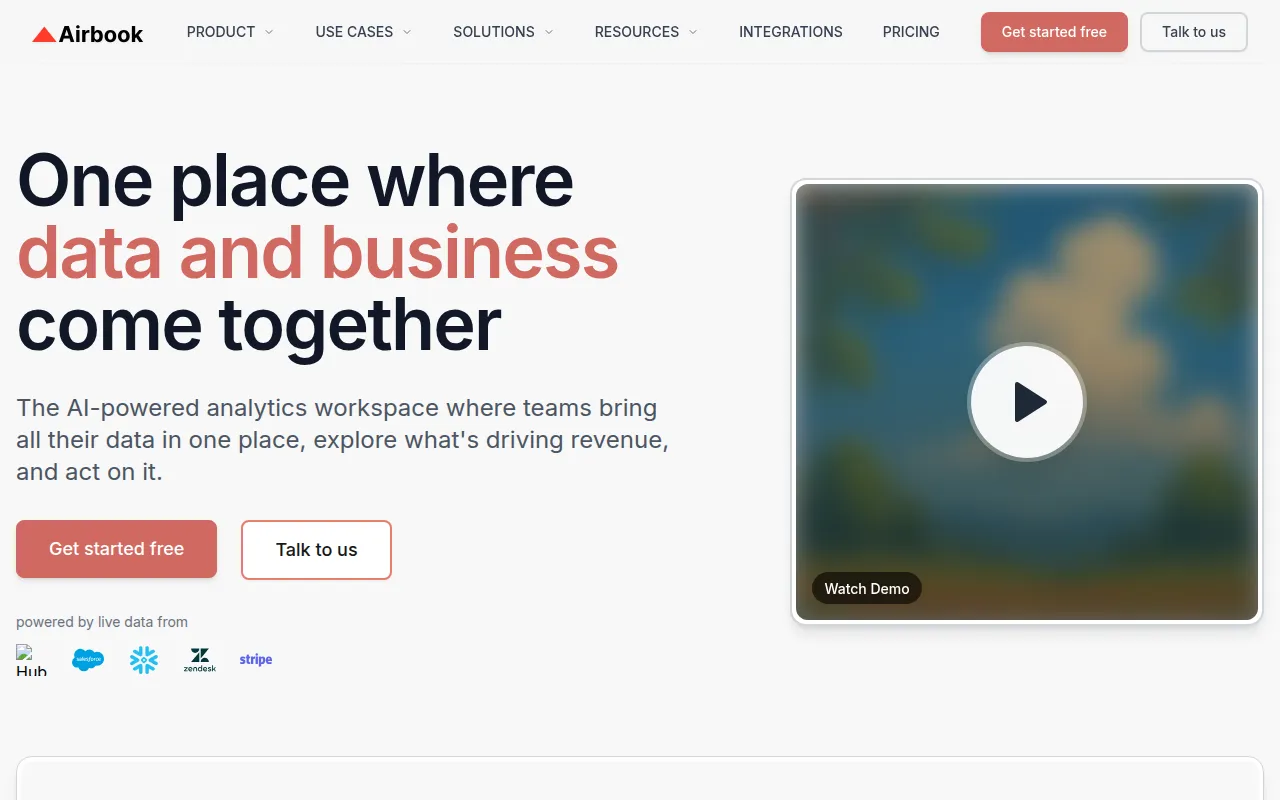 is a go-to-market analytics platform that connects data across teams to enhance decision-making and revenue optimization. This tool is especially beneficial for businesses looking to align their marketing, sales, and product teams through integrated data insights. While Dataspot provides general analytics capabilities, Airbook focuses on unifying data from various departments to create a holistic view of business performance. This is essential for companies that need collaborative insights to drive revenue effectively.
The strength of Airbook lies in its ability to connect disparate data sources, allowing teams to visualize the complete customer journey from acquisition to sales. Users can gain insights into market trends, customer behavior, and product performance, enabling them to make informed decisions that impact revenue directly. Businesses aiming for a seamless connection between their teams and data will find Airbook to be a powerful tool for achieving their go-to-market objectives.
- Key Strength: Integration of data from multiple teams for a comprehensive view of business performance.
- Key Strength: Focus on revenue optimization through collaborative insights.
- Key Strength: Visualization tools that enhance understanding of the customer journey.
- Limitation: May not cater to businesses that require standalone analytics tools.
Pricing: Freemium with scalable options for users. Best for: Businesses looking to align teams through integrated analytics for revenue optimization.
BeeBee - Best for Stock Market Analytics
BeeBee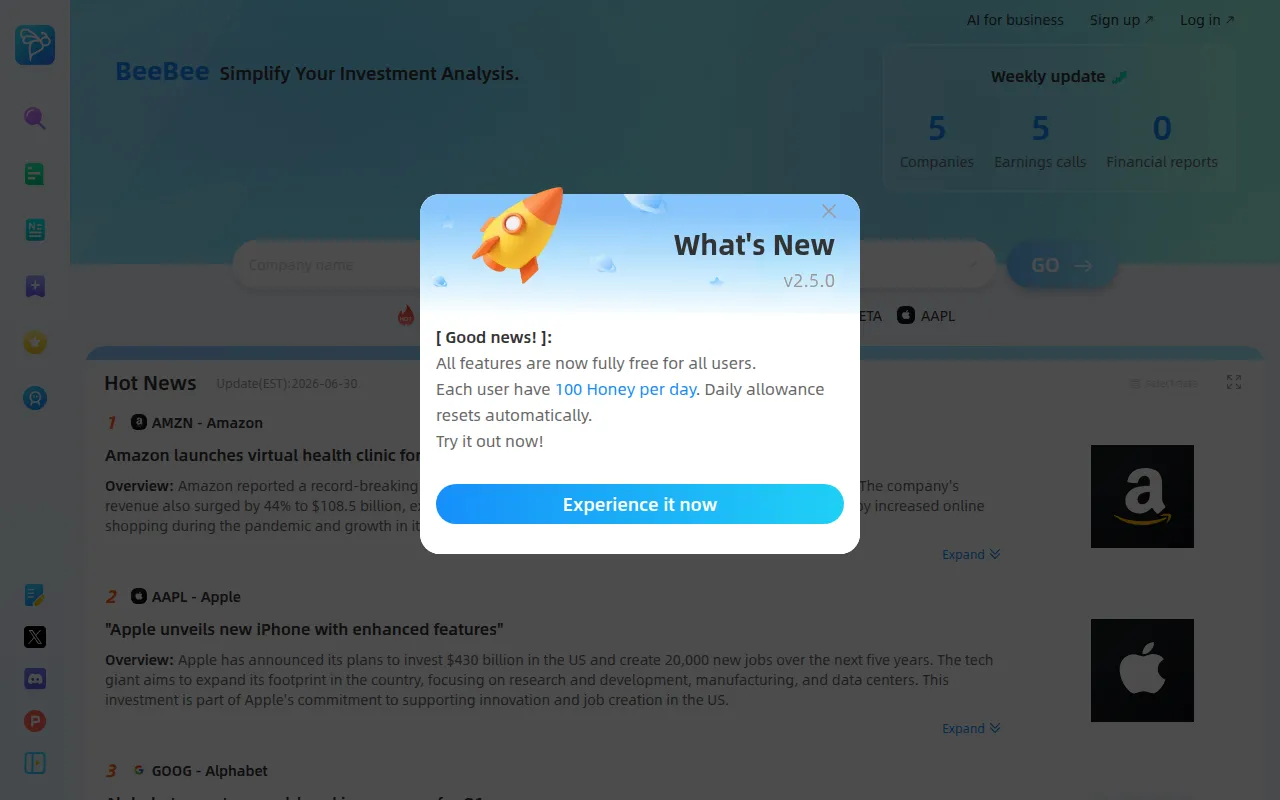 is an AI analytics tool specifically designed for the U.S. stock market, focusing on earnings reports and calls. This specialized focus makes it a unique alternative to Dataspot, which is more generalized in its analytics capabilities. Users in the finance sector, particularly those involved in stock trading and investment analysis, will find BeeBee to be a valuable resource. Its targeted features allow users to stay on top of key financial metrics and trends that impact stock performance.
What sets BeeBee apart is its ability to aggregate and analyze market data effectively, providing insights that can inform investment strategies. Users can access real-time updates on earnings reports and market shifts, enabling them to react quickly to changing conditions. This level of responsiveness is crucial for investors looking to capitalize on market opportunities. While Dataspot may not provide the same level of granularity in financial analytics, BeeBee caters specifically to the needs of stock market professionals.
- Key Strength: Focused analytics for the U.S. stock market, targeting earnings reports and calls.
- Key Strength: Real-time updates that empower investors to react swiftly to market changes.
- Key Strength: Aggregation of key market data for comprehensive analysis.
- Limitation: Limited applicability for users outside the finance sector.
Pricing: Freemium, with specific pricing information currently unavailable. Best for: Stock market professionals needing targeted analytics for investment decisions.
Shortimize - Best for Video Performance Analytics
Shortimize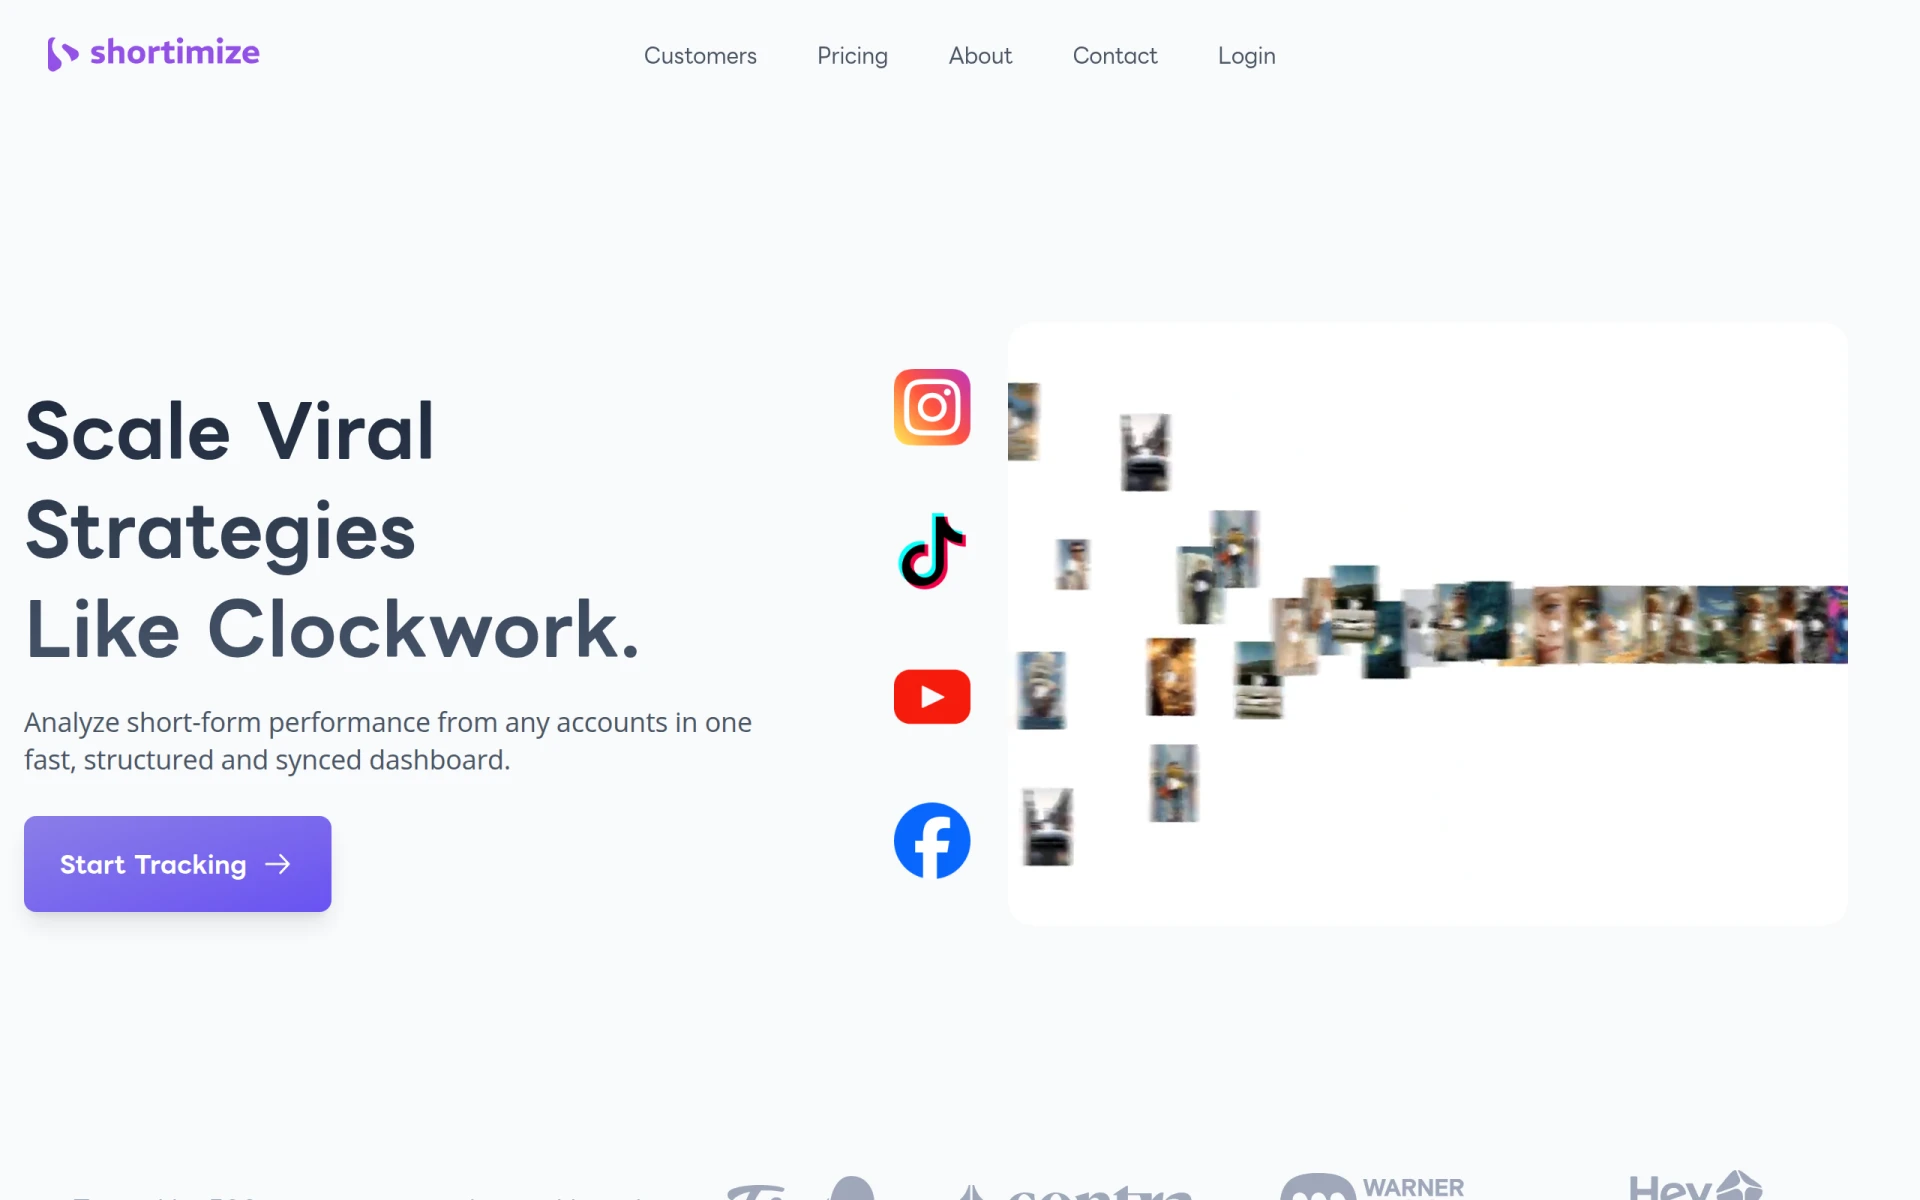 is a video analytics tool designed to track and analyze short-form video performance across multiple social media platforms. In a landscape where video content is becoming increasingly important for engagement, this tool provides marketers with the insights they need to optimize their video strategies. Unlike Dataspot, which offers a broader analysis, Shortimize focuses specifically on video metrics, making it a great choice for content creators and marketers in the digital space.
The strength of Shortimize lies in its ability to provide detailed analytics on viewer engagement, retention, and overall video performance across different platforms like YouTube, Instagram, and TikTok. Users can analyze which content resonates best with their audience, allowing for data-driven decisions on future video projects. The specialized focus on short-form video performance is particularly relevant for brands aiming to capture audience attention quickly in a crowded marketplace.
- Key Strength: Specialized focus on short-form video analytics across multiple social media platforms.
- Key Strength: In-depth metrics on viewer engagement and retention.
- Key Strength: Data-driven insights that inform future video content strategies.
- Limitation: Limited applicability for users not focused on video content.
Pricing: Plans starting from $99 per month with a 7-day free trial available. Best for: Content creators and marketers focused on optimizing short-form video performance.
Promptmonitor - Best for Brand Visibility Tracking
Promptmonitor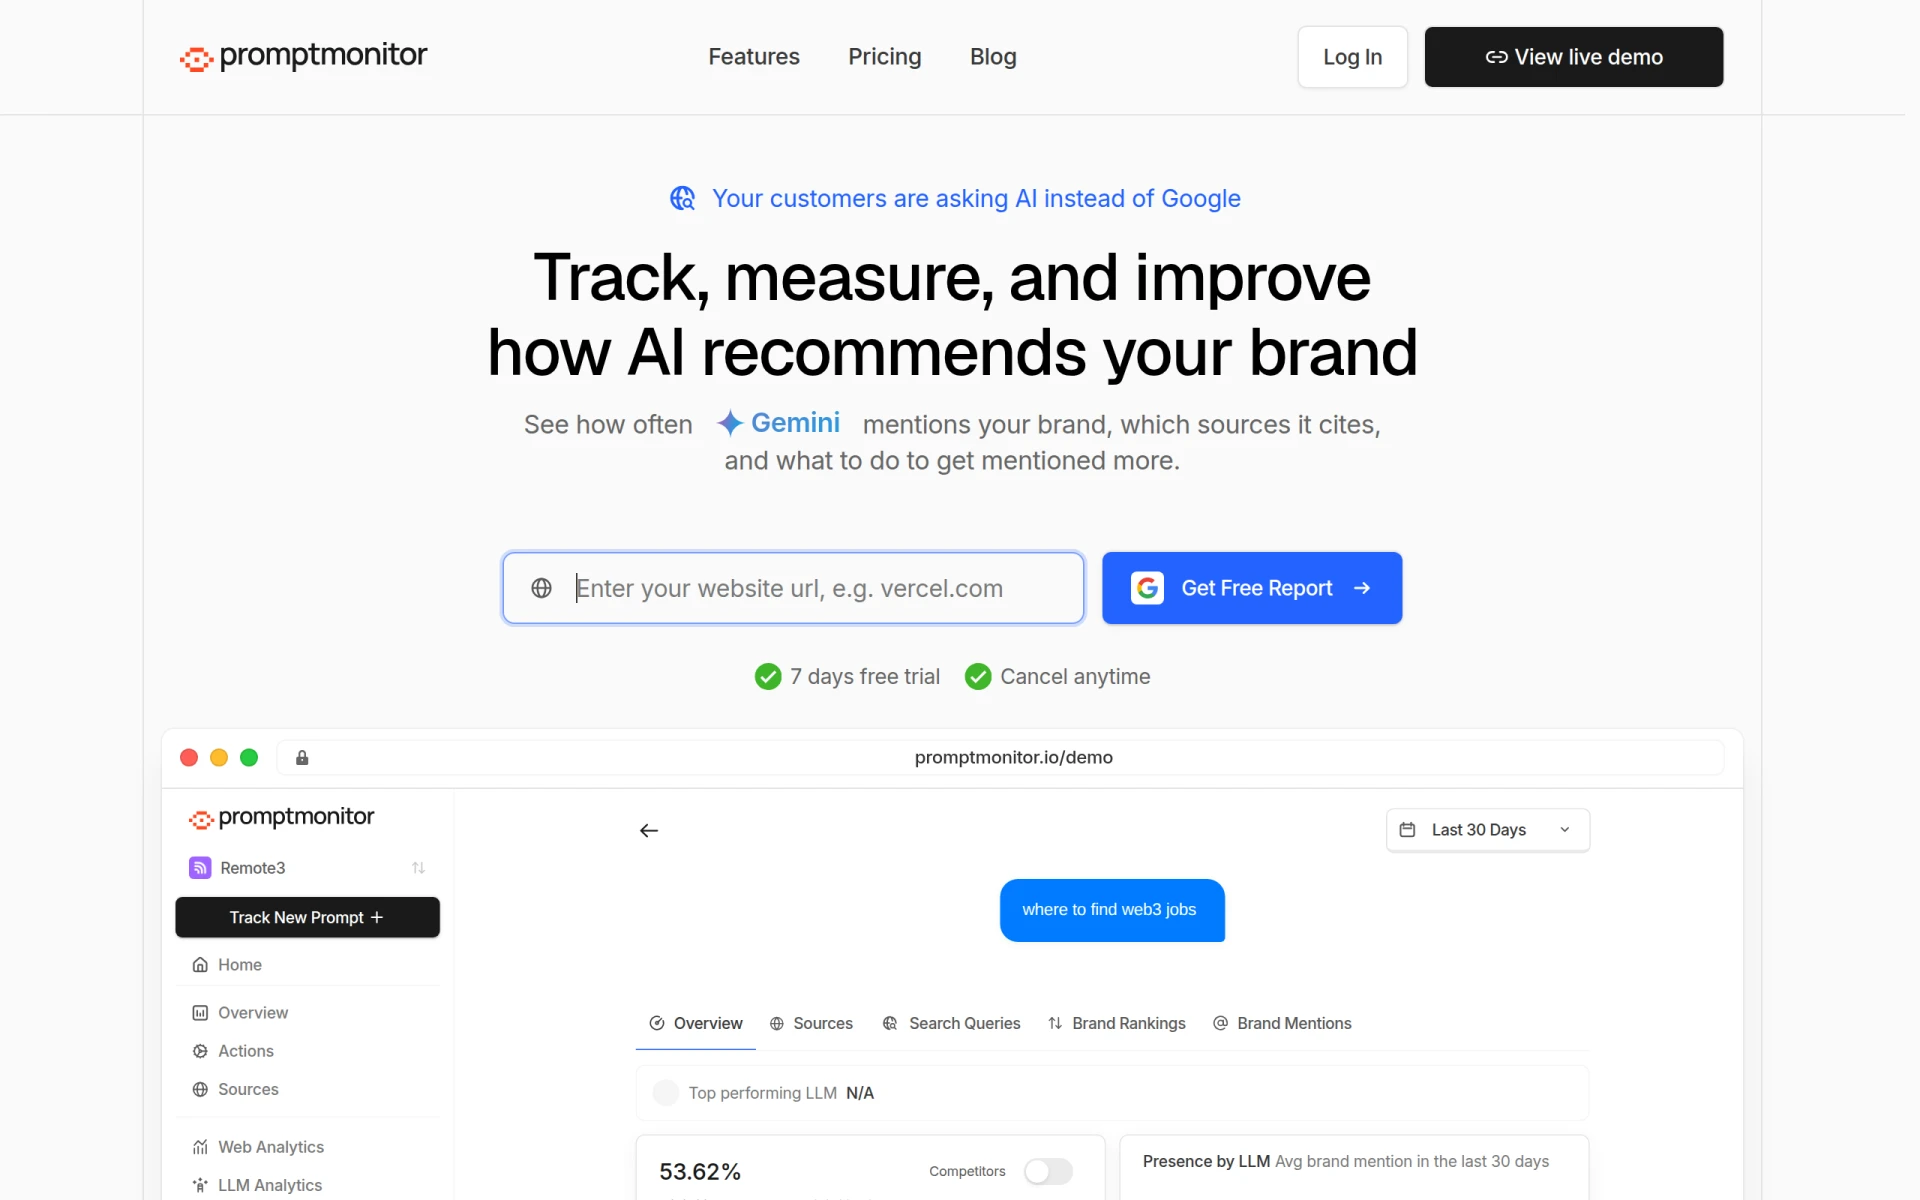 is a unique analytics tool that tracks your brand's visibility across AI platforms, helping you optimize your mentions in AI-generated content. In an era where AI-generated content is becoming more prevalent, understanding how your brand is perceived and discussed in this context is crucial. This tool offers a focused approach that differs from Dataspot's broader analytics capabilities. Users looking to enhance their brand’s visibility and reputation management will find Promptmonitor invaluable.
The tool's strengths lie in its ability to provide insights into how your brand is mentioned in AI-driven spaces, allowing companies to adapt their strategies accordingly. With real-time tracking of brand mentions, users can respond quickly to trends and discussions, enhancing their engagement with audiences. Promptmonitor is particularly beneficial for PR teams and brand managers who need to maintain a proactive approach to brand visibility in an increasingly competitive landscape.
- Key Strength: Specialized tracking of brand visibility across AI platforms.
- Key Strength: Real-time insights that allow for quick responses to brand mentions.
- Key Strength: Focus on optimizing brand reputation in the AI-generated content landscape.
- Limitation: May not provide comprehensive analytics for other business areas.
Pricing: Subscription plans starting at $29 per month with a free trial option. Best for: PR teams and brand managers focused on enhancing brand visibility in AI contexts.
Gigasheet - Best for Healthcare Analytics
Gigasheet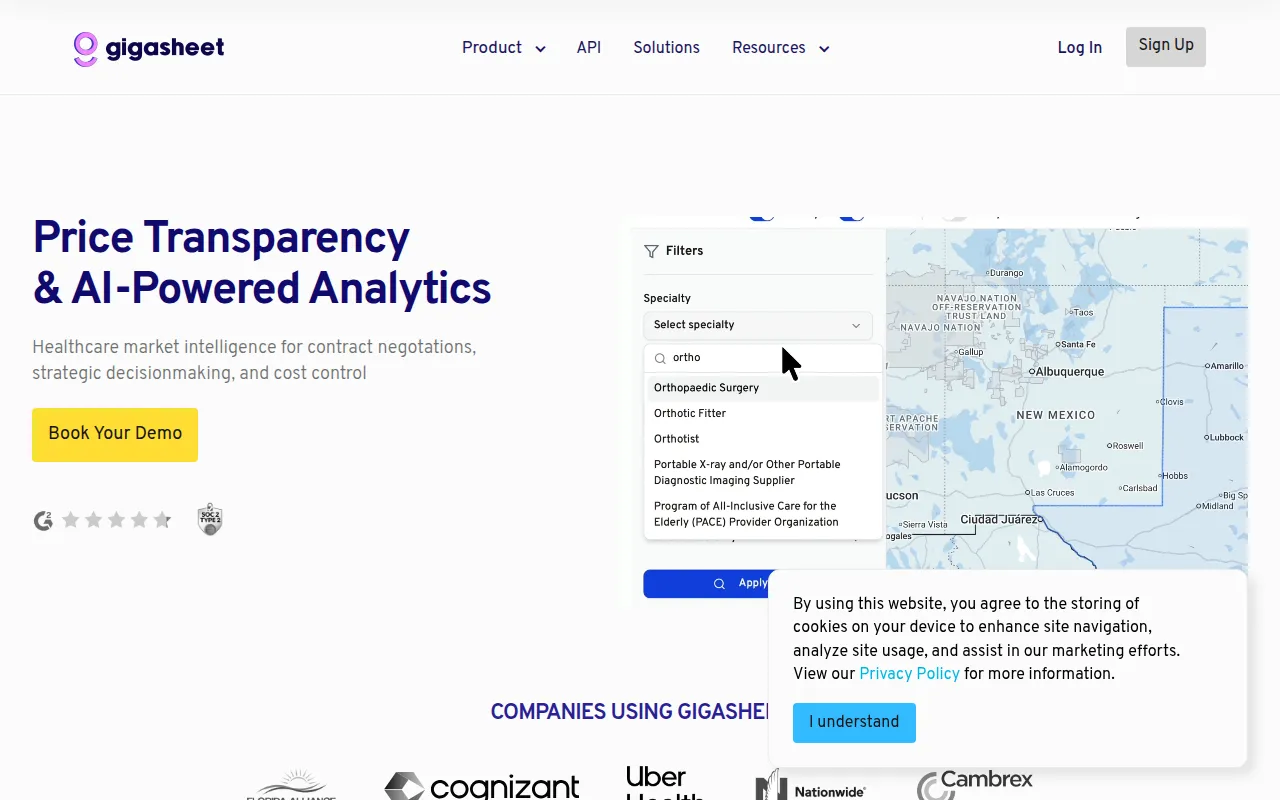 is a healthcare analytics tool that specializes in providing price transparency and market intelligence to optimize contract negotiations. This tool is particularly valuable for healthcare organizations that require detailed insights into market trends and pricing strategies. In contrast to Dataspot's general analytics approach, Gigasheet focuses specifically on the healthcare sector, making it an essential tool for professionals navigating complex pricing environments.
The platform’s ability to aggregate vast amounts of healthcare data and provide actionable insights sets it apart. Users can analyze market trends, pricing discrepancies, and competitive positioning, which are crucial for making informed decisions in a highly regulated industry. While Dataspot may not cater to niche markets like healthcare, Gigasheet provides tailored analytics that addresses specific industry needs, making it a must-have for stakeholders aiming to optimize their operations.
- Key Strength: Specialized analytics tailored for the healthcare sector with a focus on price transparency.
- Key Strength: Comprehensive market intelligence for informed contract negotiations.
- Key Strength: Aggregation of healthcare data for actionable insights.
- Limitation: Limited applicability outside the healthcare industry.
Pricing: Freemium, with specific pricing details not publicly listed. Best for: Healthcare organizations seeking specialized analytics for pricing and market strategies.
XFactor - Best for Revenue Growth Analytics
XFactor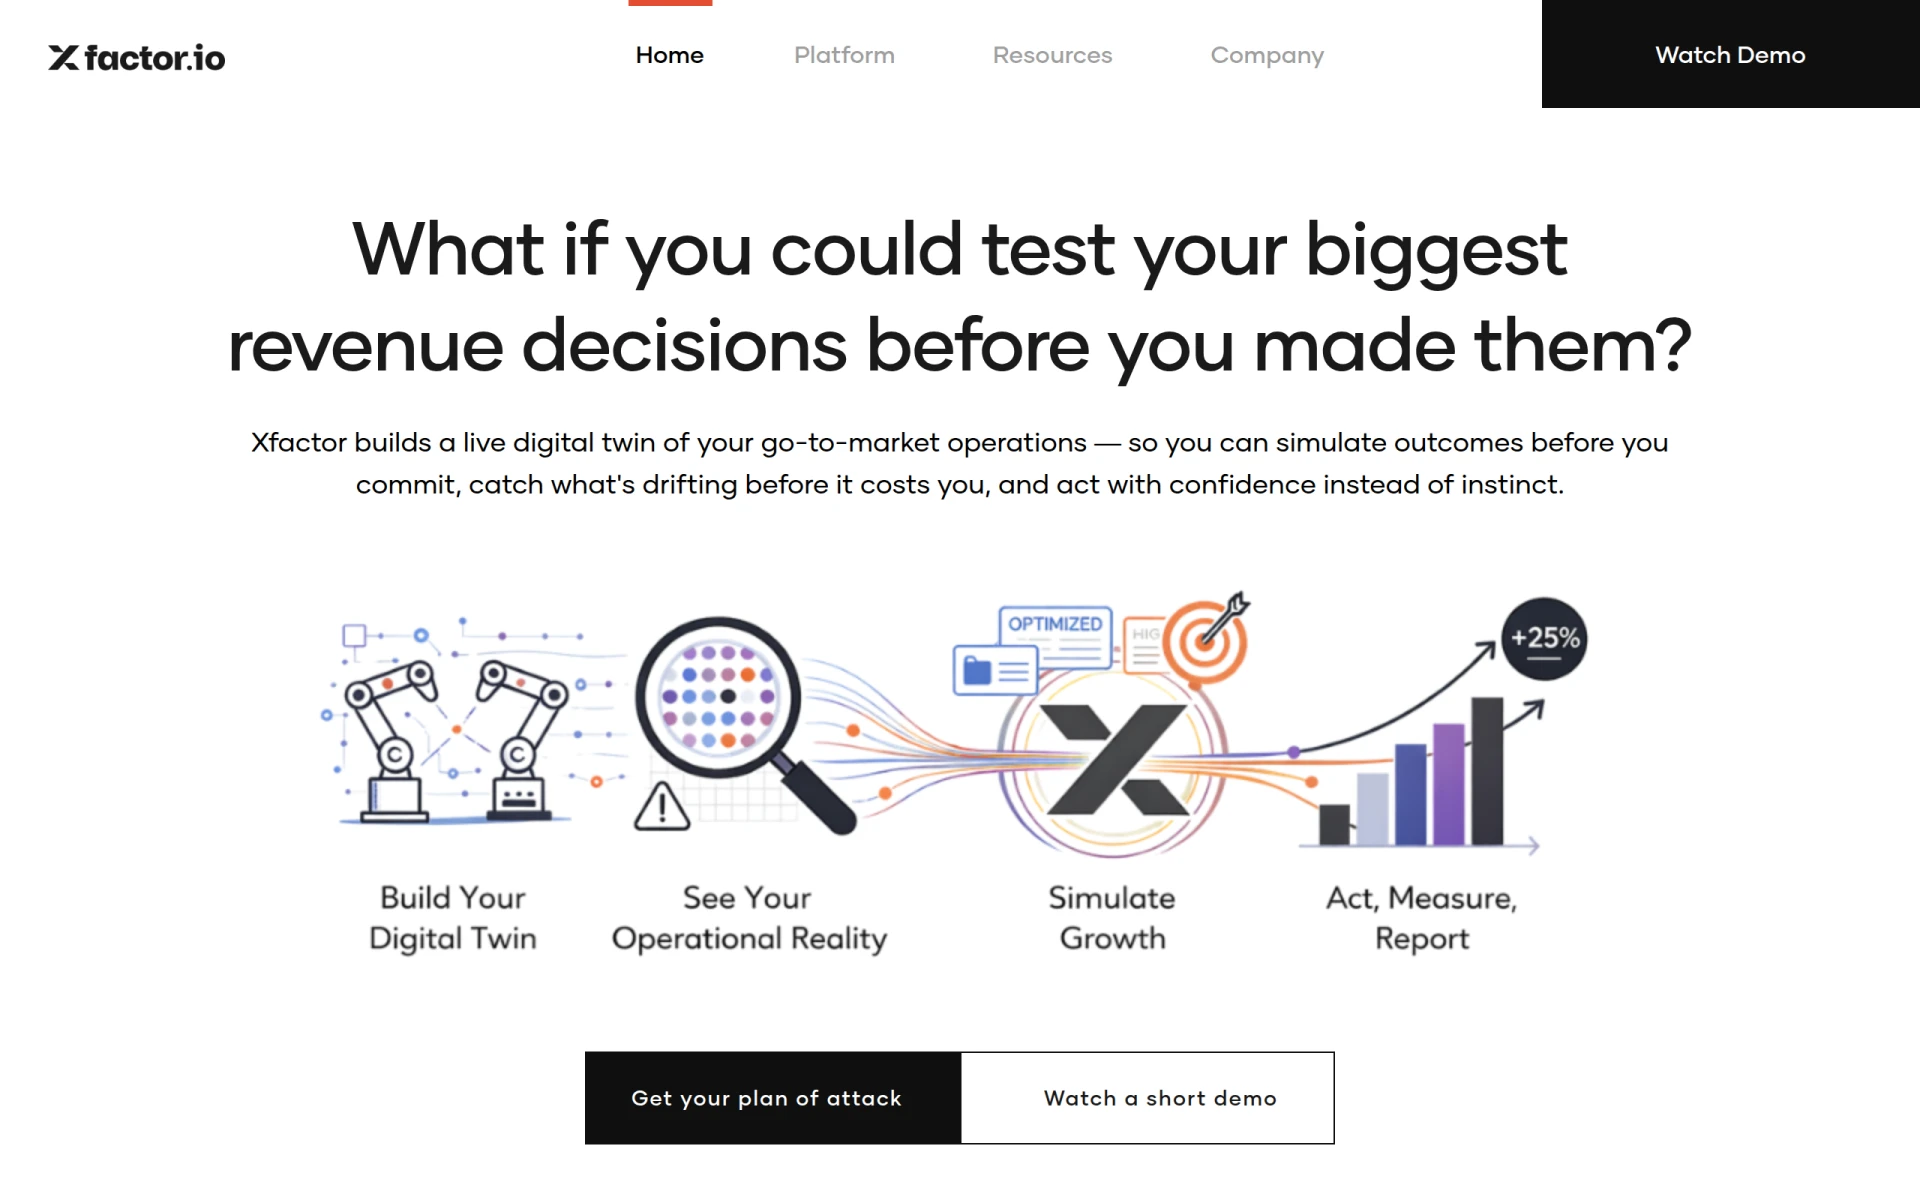 utilizes causal AI to identify revenue growth drivers, helping teams make data-driven decisions aimed at increasing revenue. This tool is particularly beneficial for businesses focused on understanding the factors that influence their financial performance. Unlike Dataspot, which may provide general analytics, XFactor dives deeply into causal relationships within data, making it a powerful tool for teams looking to enhance their revenue strategies.
What makes XFactor stand out is its advanced modeling capabilities, which allow users to analyze various factors and their impacts on revenue generation. This level of detail is essential for organizations that need to pinpoint specific drivers of growth and understand how changes in their strategies can affect overall performance. While Dataspot may not provide the same depth of analysis, XFactor offers a robust solution for businesses that need to optimize their revenue-generating activities.
- Key Strength: Causal AI modeling that identifies specific revenue growth drivers.
- Key Strength: Advanced analytics capabilities tailored for revenue optimization.
- Key Strength: Insights that inform strategic adjustments for increased performance.
- Limitation: Requires a more advanced understanding of data analysis techniques.
Pricing: Contact for pricing information. Best for: Businesses focused on optimizing revenue through detailed causal analysis.
BioRaptor - Best for Bioprocessing Data Analytics
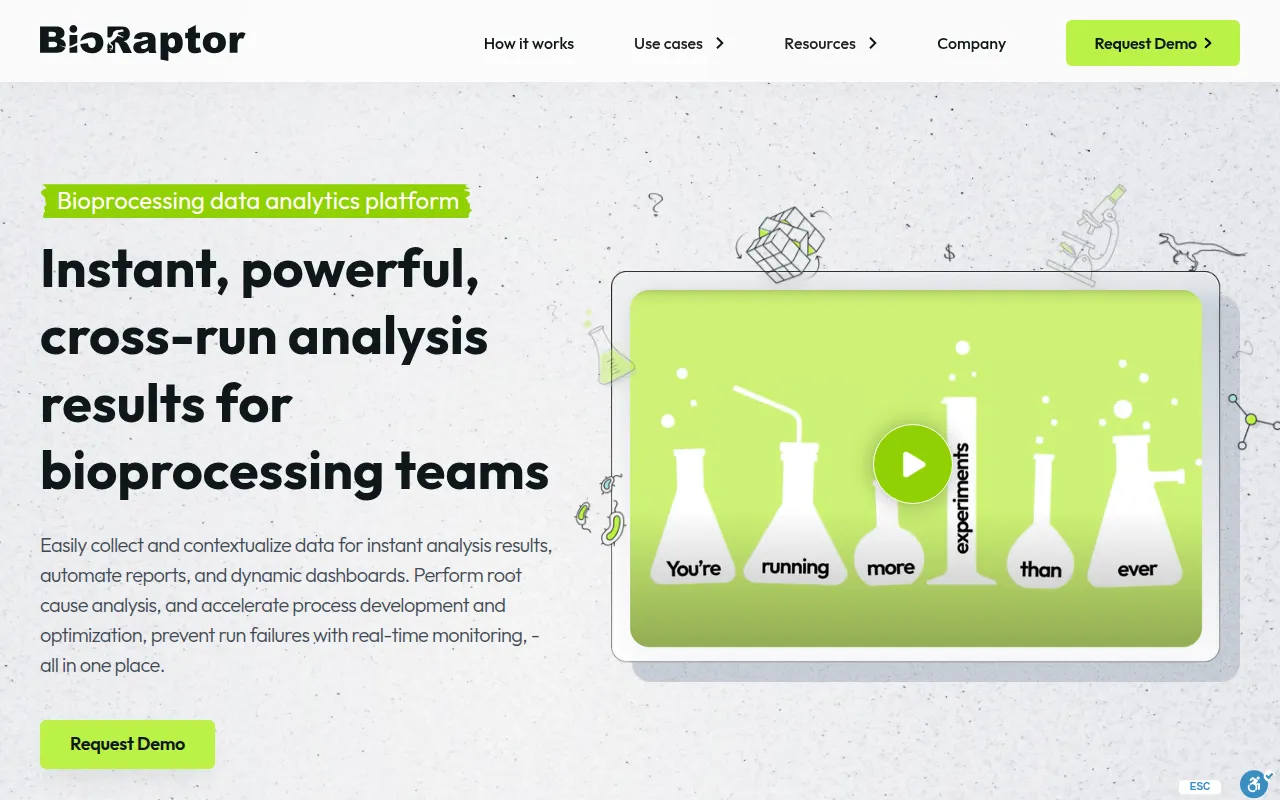
BioRaptor is a bioprocessing data analytics platform that helps teams analyze and optimize their bioprocessing workflows efficiently. This tool is specifically designed for the life sciences industry, making it a specialized alternative to Dataspot, which offers a broader analytics approach. BioRaptor is invaluable for organizations involved in research and development, manufacturing, and quality assurance within bioprocessing. Its tailored features allow users to track performance metrics and enhance their processes effectively.
The platform excels at aggregating data from various bioprocessing stages, providing users with insights that drive operational improvements. By focusing on the unique needs of bioprocessing workflows, BioRaptor allows teams to identify bottlenecks and optimize their processes, ultimately leading to improved product yields and quality. While Dataspot may not cater specifically to bioprocessing, BioRaptor provides a robust solution for organizations operating in this specialized field.
- Key Strength: Tailored analytics for bioprocessing workflows, enhancing operational efficiency.
- Key Strength: Comprehensive data aggregation from various stages of bioprocessing.
- Key Strength: Insights that drive process optimization and product quality improvements.
- Limitation: Limited applicability for users outside the life sciences industry.
Pricing: Contact for pricing information. Best for: Organizations in the life sciences sector focused on optimizing bioprocessing workflows.
Amazon Forecast - Best for Time Series Forecasting
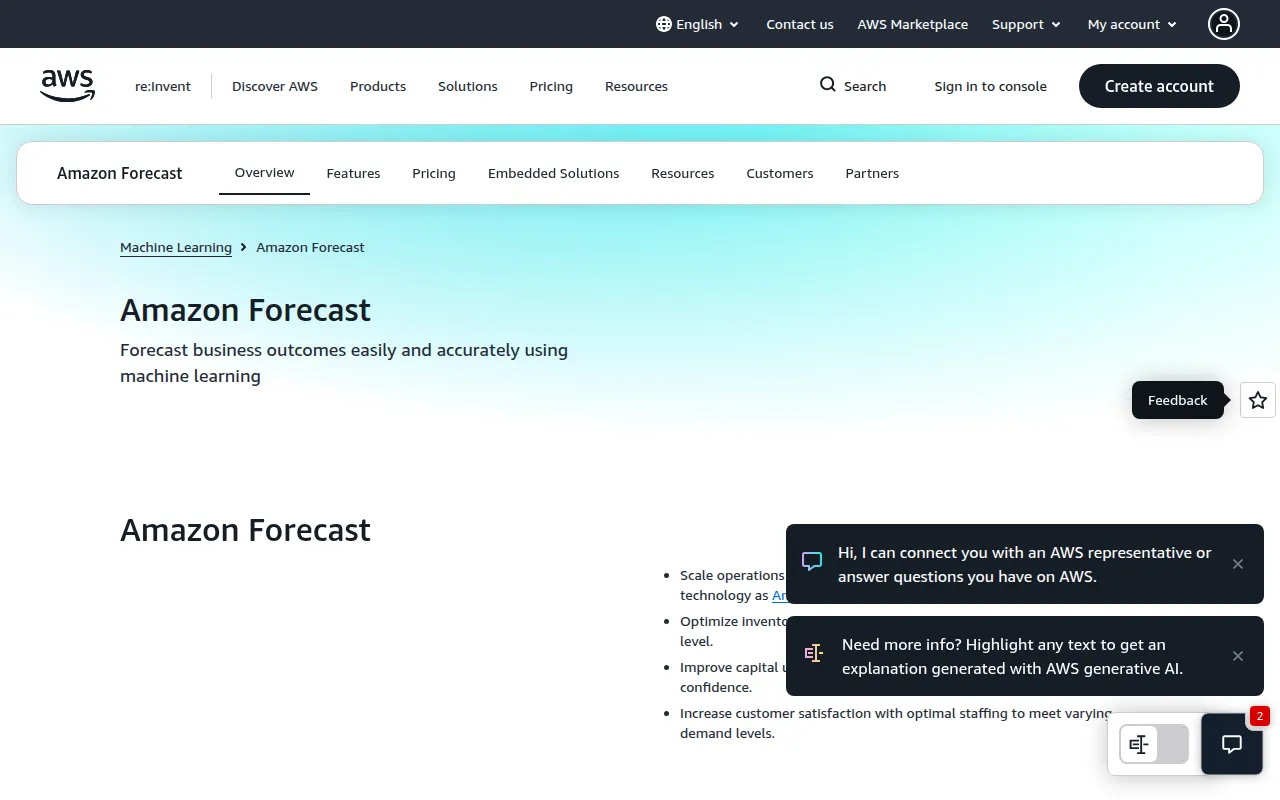
Amazon Forecast is a fully managed time series forecasting service that utilizes machine learning to optimize business outcomes. This tool stands out for its ability to provide accurate forecasts based on historical data, making it particularly useful for businesses that rely on demand planning and inventory management. In contrast to Dataspot, which may provide general analytics, Amazon Forecast focuses specifically on predictive analytics, helping organizations plan for future scenarios effectively.
The strength of Amazon Forecast lies in its advanced machine learning algorithms, which can analyze vast amounts of historical data to generate precise forecasts. This capability is essential for companies looking to optimize their inventory levels and reduce costs associated with overstocking or stockouts. By using Amazon Forecast, businesses can gain a competitive edge through better planning and resource allocation, making it a powerful tool for data-driven decision-making.
- Key Strength: Advanced machine learning algorithms for accurate time series forecasting.
- Key Strength: Fully managed service that reduces the complexity of implementing forecasting models.
- Key Strength: Insights that enhance demand planning and inventory management strategies.
- Limitation: Requires familiarity with AWS services for optimal use.
Pricing: Paid, based on data usage and forecasting needs. Best for: Businesses needing robust time series forecasting capabilities for planning and inventory management.
Feature Comparison Table
| Tool | Best For | Starting Price | Free Plan | Standout Feature |
|---|
| Dataspot | General data analysis | Freemium | Yes | Data visualization capabilities |
| PlotStudio AI | AI-driven reporting | Freemium | Yes | Automated report generation |
| ChartPixel | Interactive data visualization | Freemium | Yes | Real-time analytics |
| Pandada AI | Non-technical users | Freemium | Yes | Automatic data cleaning |
| TextQL | Natural language querying | Freemium | Yes | Plain English queries |
| Metaplane | Data quality monitoring | Freemium | Yes | Proactive data integrity alerts |
| Uptrends.ai | Website performance analytics | Freemium | Yes | Uptime and page speed monitoring |
| Arcwise | Early metric detection | Contact | No | Real-time metric alerts |
| Airbook | Go-to-market analytics | Freemium | Yes | Data integration from multiple teams |
| BeeBee | Stock market analytics | Freemium | Yes | Focus on earnings reports |
| Shortimize | Video performance analytics | $99/month | 7-day free trial | In-depth engagement metrics |
| Promptmonitor | Brand visibility tracking | $29/month | Free trial | Real-time brand mention tracking |
| Gigasheet | Healthcare analytics | Freemium | Yes | Price transparency insights |
| XFactor | Revenue growth analytics | Contact | No | Causal AI modeling |
| BioRaptor | Bioprocessing analytics | Contact | No | Data aggregation for bioprocessing |
| Amazon Forecast | Time series forecasting | Paid | No | Machine learning forecasting |
How to Choose the Right Alternative to Dataspot
When selecting an alternative to Dataspot, it is essential to consider your specific analytics needs and the context in which you will be using the tool. If your organization requires advanced reporting capabilities and has a focus on aesthetics, PlotStudio AI might be the best fit. For teams that prioritize interactive data exploration and real-time feedback, ChartPixel offers a compelling solution. Non-technical users seeking straightforward analysis should gravitate towards Pandada AI, which simplifies the process without compromising on insights.
For organizations that operate in niche markets, such as healthcare or finance, specialized tools like Gigasheet and BeeBee will provide tailored insights that a more generalized tool like Dataspot may lack. Similarly, if your focus is on data quality or brand visibility, consider Metaplane or Promptmonitor, respectively. Ultimately, understanding your specific use cases and the features that matter most to your team will guide you to the right alternative for your analytics needs.
Final Verdict
In conclusion, while Dataspot may serve as a foundational analytics tool, the alternatives listed above provide specialized features that cater to various business needs. For organizations focused on real-time insights, ChartPixel and Uptrends.ai shine brightly, while those looking for advanced reporting capabilities will benefit from PlotStudio AI. Ultimately, the right choice will depend on the specific requirements and objectives of your team.